Note: The Range list is not available for the Multi-LJ Chart.
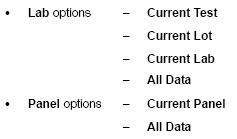
The range of available data for the chart depends on the Lab or Panel option when the chart was created.

Tip: To conserve toner when printing charts, clear the Print background color check box.
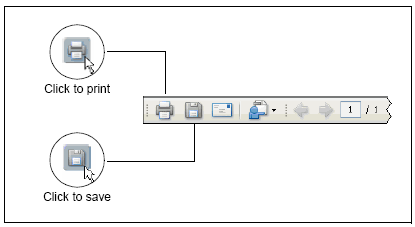
The chart opens in a separate window in PDF format.

Note: Depending on the version of Adobeâ Readerâ installed on your computer, the icons may look slightly different.