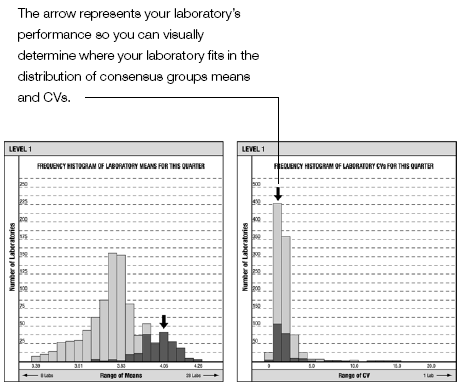
Frequency Histograms
The frequency histogram section of the Statistical Profile Report contains two frequency histograms which show the location of:
- Your laboratory's means for the quarter plotted on the range of means for the Method and All Labs consensus groups.
- Your laboratory's coefficient of variation (CV) for the quarter plotted on the range of CVs for the Method and All Labs consensus groups.
Each histogram has an arrow indicating your laboratory's mean and CV values.
Example Frequency Histogram