![]()
![]()
![]()
![]()
|
|
|
|
|
The lines on the OPSpecs Chart divide the chart into three sections.
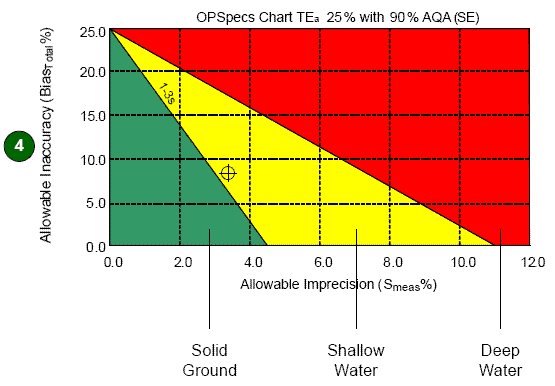
Dr. James Westgard describes the three sections using the following terms.
This is the area below the line for Limits of bias and imprecision for suggested QC procedure (Operating Limits line). This is where the Operating Point should appear. The position of the Operating Point varies depending on the rule(s) it represents. Use different TEa and consensus group criteria to generate multiple sets of rules. Review the OPSpecs Chart before deciding which rules to apply.
This is the area between the Maximum limits of a stable process line and the Limits of bias and imprecision for suggested QC procedure (Operating Limits line) line representing the suggested QC procedure. If the Operating Point appears in this area, it is best to consider other rule combinations and try to improve the test method performance.
This is the area above the Maximum limits of a stable process line. If the Operating Point is in this area, consider other rule combinations and attempt to improve the test method performance. If the Operating Point is in this area, Westgard Advisor™ online will most likely recommend a maximum QC procedure.
See Also |