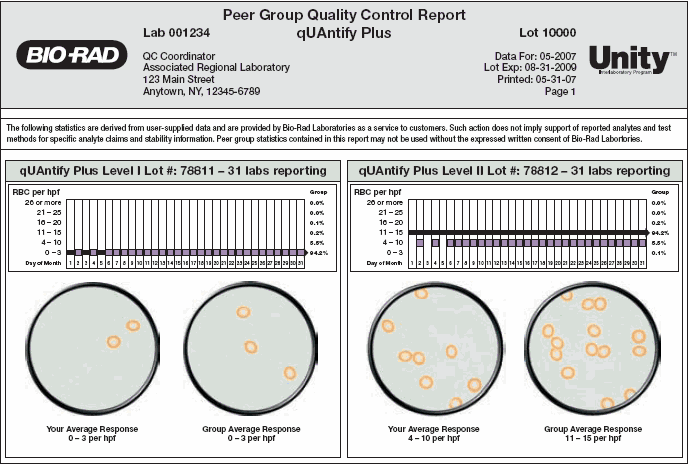
Graphics on the report simulate your average response and the group's average response. Your daily responses appear above the graphics with an arrow to indicate the majority group response.
The following figure shows a portion of the report. The complete report includes RBC, WBC, and crystals.

See Also |