Note: The Range list is not available for the Multi-LJ Chart.
The range of available data for the chart depends on the Lab or Panel option when the chart was created.
|
– Current Test – Current Lot – Current Lab – All Data |
|
– Current Panel – All Data |
3. Select the Print background color check box to print the chart background as it appears on the screen.
Tip: To conserve toner when printing charts, clear the Print background color check box.
4. Click OK.
The chart opens in a separate window in PDF format.
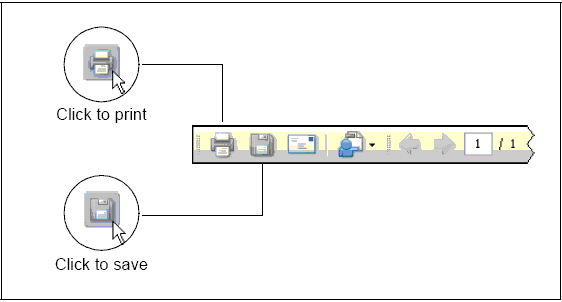
5. Click the appropriate icon to print or save the chart.

Note: Depending on the version of Acrobat® Reader® installed on your computer, the icons may look slightly different.